How to monitor Celery in production
Celery works fine until it doesn't, and when it breaks it tends to break quietly. This guide covers what to watch for in production, the common ways teams handle Celery monitoring, and how to pick between them. Whether you're running three workers or three hundred, the right setup looks roughly the same.
What to monitor
Celery monitoring breaks down into four signal types: tasks, workers, beat schedules, and queue depth. They each fail differently. Tasks usually fail loudly, workers fail silently, beat fails invisibly, queue depth fails slowly. A setup that only watches one or two of them will miss most of what actually goes wrong.
Task lifecycle
Tasks are the easiest signal to monitor and the most common entry point. The basics are: how many tasks ran, how many succeeded, how many retried, how long they took, and what exceptions came up. Most teams start here because Celery itself emits signals for all of it.
The interesting failures aren't "tasks suddenly start crashing," because that part is loud and obvious. The interesting ones are slow regressions in success rate from 99.9% to 99.4%, a single task type retrying eight times where it used to retry once, p99 runtime drifting up week over week, or a new exception class appearing that nobody knew was possible. None of these page anyone immediately. All of them eventually become something that does.
Worker health
Workers fail in two ways. Loudly, where you see the stack trace and the supervisor restarts them, and silently, where the process is still running but isn't actually consuming tasks. The silent case is worse because nothing alerts you. The queue just slowly fills up.
Heartbeats catch most of this. A Celery worker emits a heartbeat event every two seconds by default, and if you stop seeing them from a worker that's supposedly online, that worker is dead in the way that matters. The case heartbeats won't catch is a worker that's still beating but has its consumer wedged (stuck on a long task, blocked on a third-party call). That one falls to queue depth instead. The other thing worth tracking is which hostname each worker reports, so you can map them back to your infrastructure.
Beat schedules
Beat is the part of Celery that fires scheduled tasks. It's also the part most teams forget to monitor, which is how you end up with the war story about the nightly invoice job that quietly stopped firing eight weeks ago and nobody noticed until accounting did.
What you want is: when did each scheduled task last fire, and is that consistent with its expected interval. A task scheduled to run every hour that hasn't fired in three hours is broken. A task scheduled for midnight that fires at 12:23 every day has clock drift you should know about. Most beat issues aren't "the schedule is wrong," they're "the schedule worked fine for months and then quietly stopped working." That's why the last-fired timestamp matters more than any other beat signal.
For a deeper look at the six ways beat fails in production and why this signal is the most overlooked part of Celery monitoring, see Celery beat monitoring: the underserved problem.
Queue depth
Queue depth is the number of tasks sitting in the broker waiting to run. A growing queue means producers are outpacing consumers, or that workers have wedged in the way heartbeats can't see. A constantly-growing queue means real trouble.
Worth knowing: this signal isn't useful for fast tasks on a fat worker pool because the depth never gets above a handful. It matters most when you have tasks that take seconds or minutes (image processing, report generation, third-party API calls) and a producer that can spike (a bulk import, a cron-triggered fanout, a viral moment). Per-queue, not aggregate, since one slow background queue dragging behind doesn't always mean the whole system is in trouble.
What Celery gives you out of the box
Before reaching for any tool, it's worth knowing that Celery itself ships with command-line introspection. celery -A myapp inspect ping pings every worker and times out anyone who doesn't respond. celery -A myapp inspect active shows what each worker is currently processing. celery -A myapp status lists registered workers. celery -A myapp events --dump streams the raw event firehose to stdout.
These are useful for ad-hoc "what's happening right now" debugging. They're free, they require no install beyond Celery itself, and they answer most one-off questions.
What they don't give you: persistence, alerting, or any historical view. The output disappears when you close the terminal. Nothing pages you when something goes wrong while you're not looking. They're the baseline, not the answer.
Approaches
Flower
Flower is the most popular Celery monitoring tool and has been for years. It's a real-time inspector: a web UI that shows tasks currently running, workers currently online, and lets you click through to revoke or rate-limit individual tasks. For local development and ad-hoc "what is happening right now" debugging, it's hard to beat.
Where it gets thinner: task history lives in memory by default, so a Flower restart (deploy, container recycle, OOM kill) wipes everything you've collected. There is an opt-in persistent mode that writes to a local file, but it's off by default and has had longstanding reliability issues. Either way, Flower can only show you events that happened while it was running — anything that fired during a Flower outage is invisible forever, no replay. There's no built-in alerting (Flower exposes a Prometheus endpoint, so you can scrape that and route through Alertmanager, but nothing in Flower itself pages you). Auth is a config exercise: pick basic auth or OAuth2 with Google, GitHub, GitLab, or Okta, wire up the provider credentials, and most teams park it behind a reverse proxy anyway. Plenty of teams run Flower in prod successfully, but most have layered something else underneath it for the "tell me when something goes wrong overnight" part. Flower answers what's happening now. It doesn't answer what happened while you were asleep.
Celery events plus Prometheus and Grafana
Celery emits events for everything that happens internally (task started, task succeeded, task failed, worker online, worker offline, beat fire, and so on) and the standard pattern is to consume those events with a small process that re-emits them as Prometheus metrics. From there you build Grafana dashboards on top, write alert rules, configure storage retention, and you've got a setup tailored to whatever you specifically care about.
The upside is total control. The downside is the work involved. Even for someone who already knows the Prometheus stack, you're writing the events consumer, getting the exporter packaged and deployed, building the dashboards from scratch, tuning the alert thresholds so you don't get paged at 3am for noise, figuring out how to handle worker hostname churn in Kubernetes, and dealing with retention math.
Then there's the ongoing maintenance. New task types need new dashboard panels. Alert thresholds need tuning when traffic patterns change. Someone has to own it. This is the right call when you've got platform engineering capacity and want everything in your existing observability stack. It's not the right call if you're a small team and Celery is one of fifteen things you don't have time to maintain a custom setup for.
APM tools (Sentry, Datadog, New Relic)
If you're already running Sentry, Datadog, or New Relic, all three have some Celery integration. Worth a serious look before adding another tool to your stack.
Sentry's Celery support is broader than its "Errors" reputation suggests: task exception capture, performance traces (always sampled to control quota burn — the rate is yours to set), and Sentry Crons for Beat schedule monitoring (auto-instrumented via monitor_beat_tasks=True). The gaps for Celery specifically are worker offline detection and queue depth — neither has a native signal. The deeper difference is framing: Sentry treats your Celery deployment as a stream of tagged transactions rather than as a Celery system, which is great if you came for errors and stayed for performance, less compelling if Celery is the thing you're primarily trying to keep running.
Datadog and New Relic both have Celery support too — New Relic auto-instruments tasks as APM transactions; Datadog scrapes Flower's Prometheus endpoint (and inherits Flower's restart-wipes-state fragility). Queue depth is reachable through their generic broker integrations, but neither has native beat schedule miss detection or first-class worker offline detection. Both also bundle Celery monitoring inside a broader APM platform priced by hosts or data ingest, which makes sense when you're already running the platform for everything else — and less sense when Celery is the only thing you're trying to monitor.
CeleryRadar
CeleryRadar is a hosted Celery monitoring service. You install one Python package, call connect() in your Celery app, and the four signal types from above start showing up in a dashboard within seconds. There's nothing to deploy, no events consumer to maintain, no Prometheus exporters to package, no dashboards to build.
The setup looks like this:
import celeryradar_sdk

celeryradar_sdk.connect(
    api_key="cr_...",
    app_name="myproject",
)
That's the wiring. The SDK hooks Celery's standard task signals so it doesn't depend on what broker you're using. Async and non-blocking by design, so a slow ingest endpoint can't back up your worker pool.
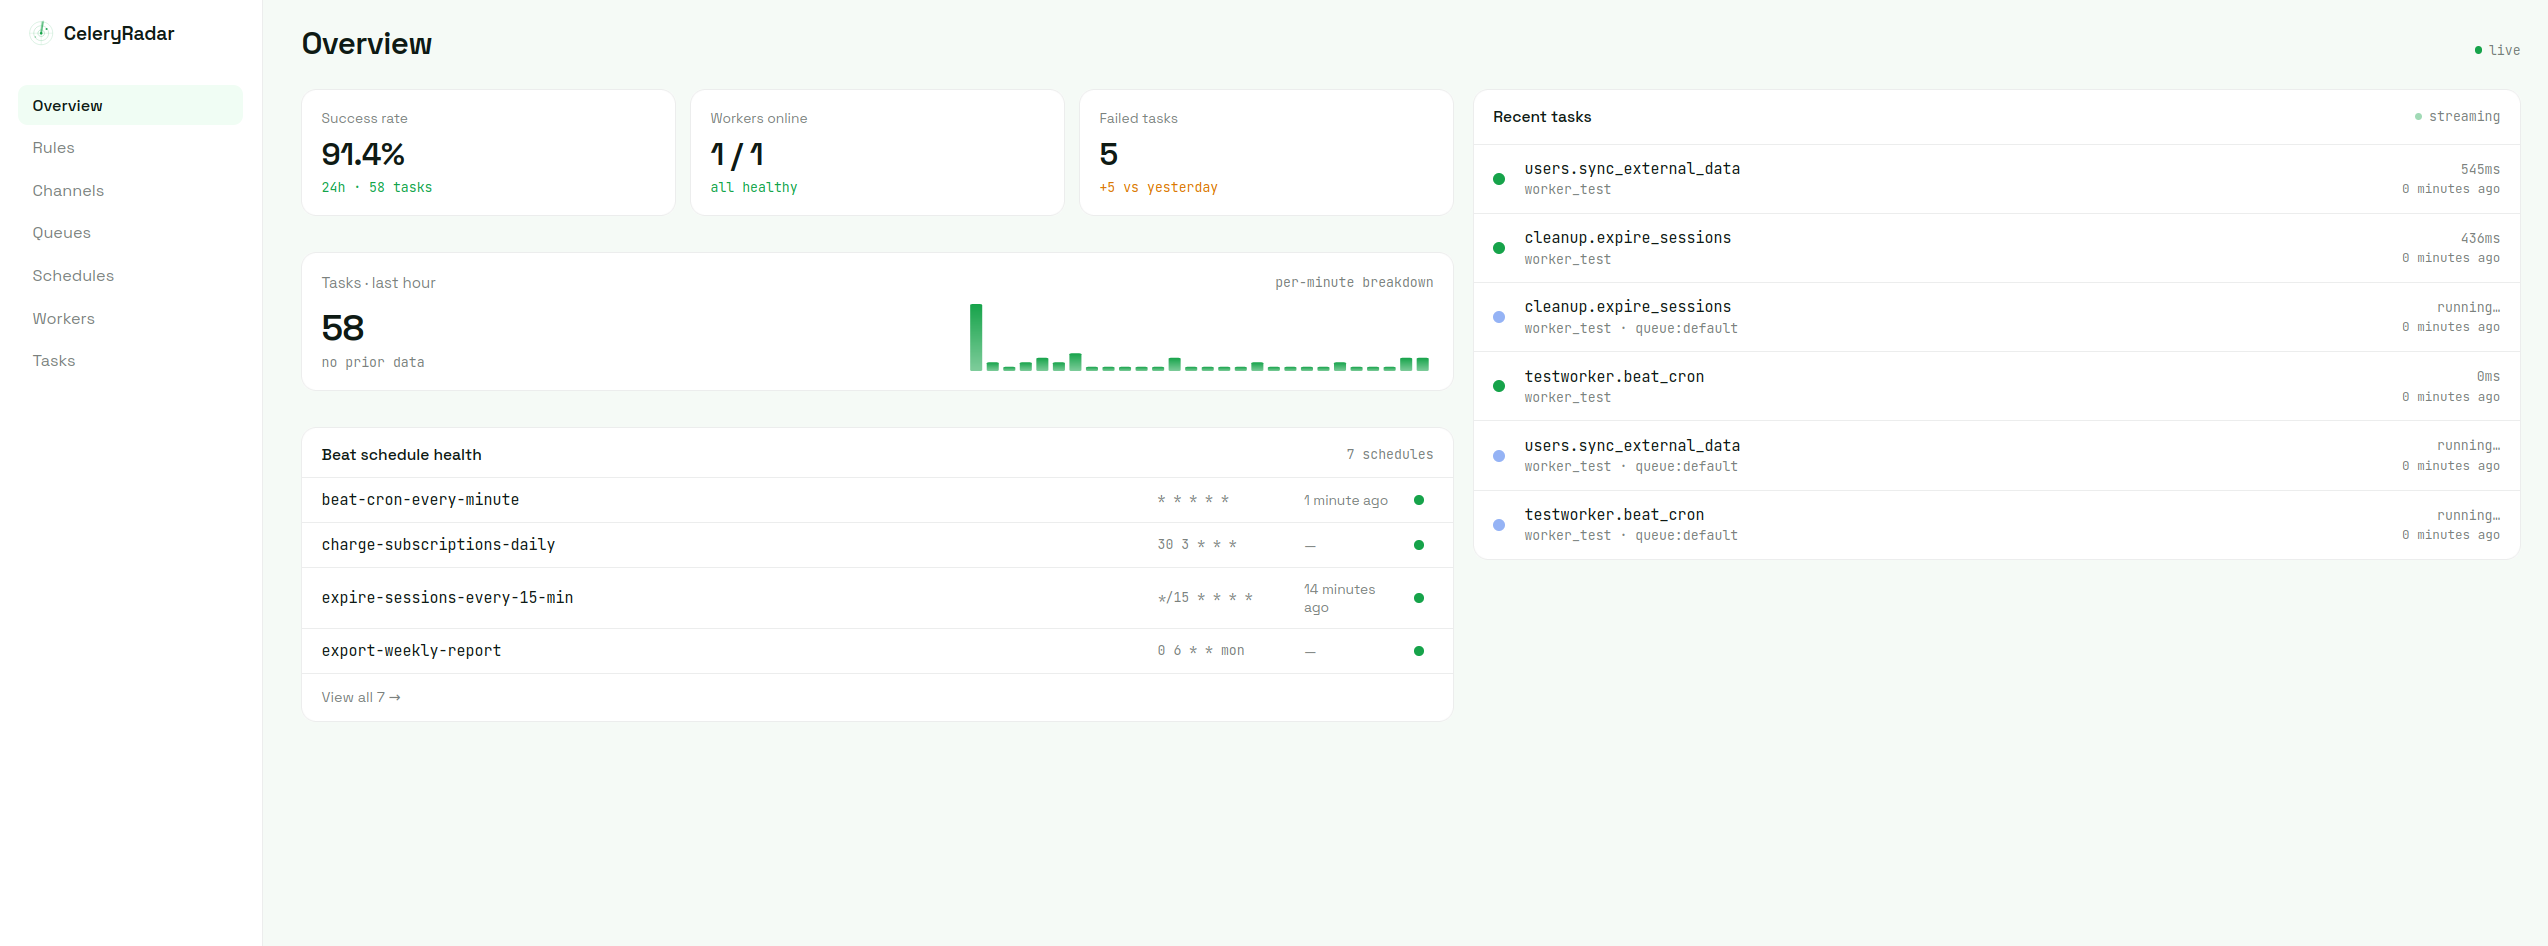
The overview gives you what you'd expect in one view: success rate over the last 24 hours, workers currently online, failed task count, throughput per minute, beat schedule health, and the most recent task events as a live feed.
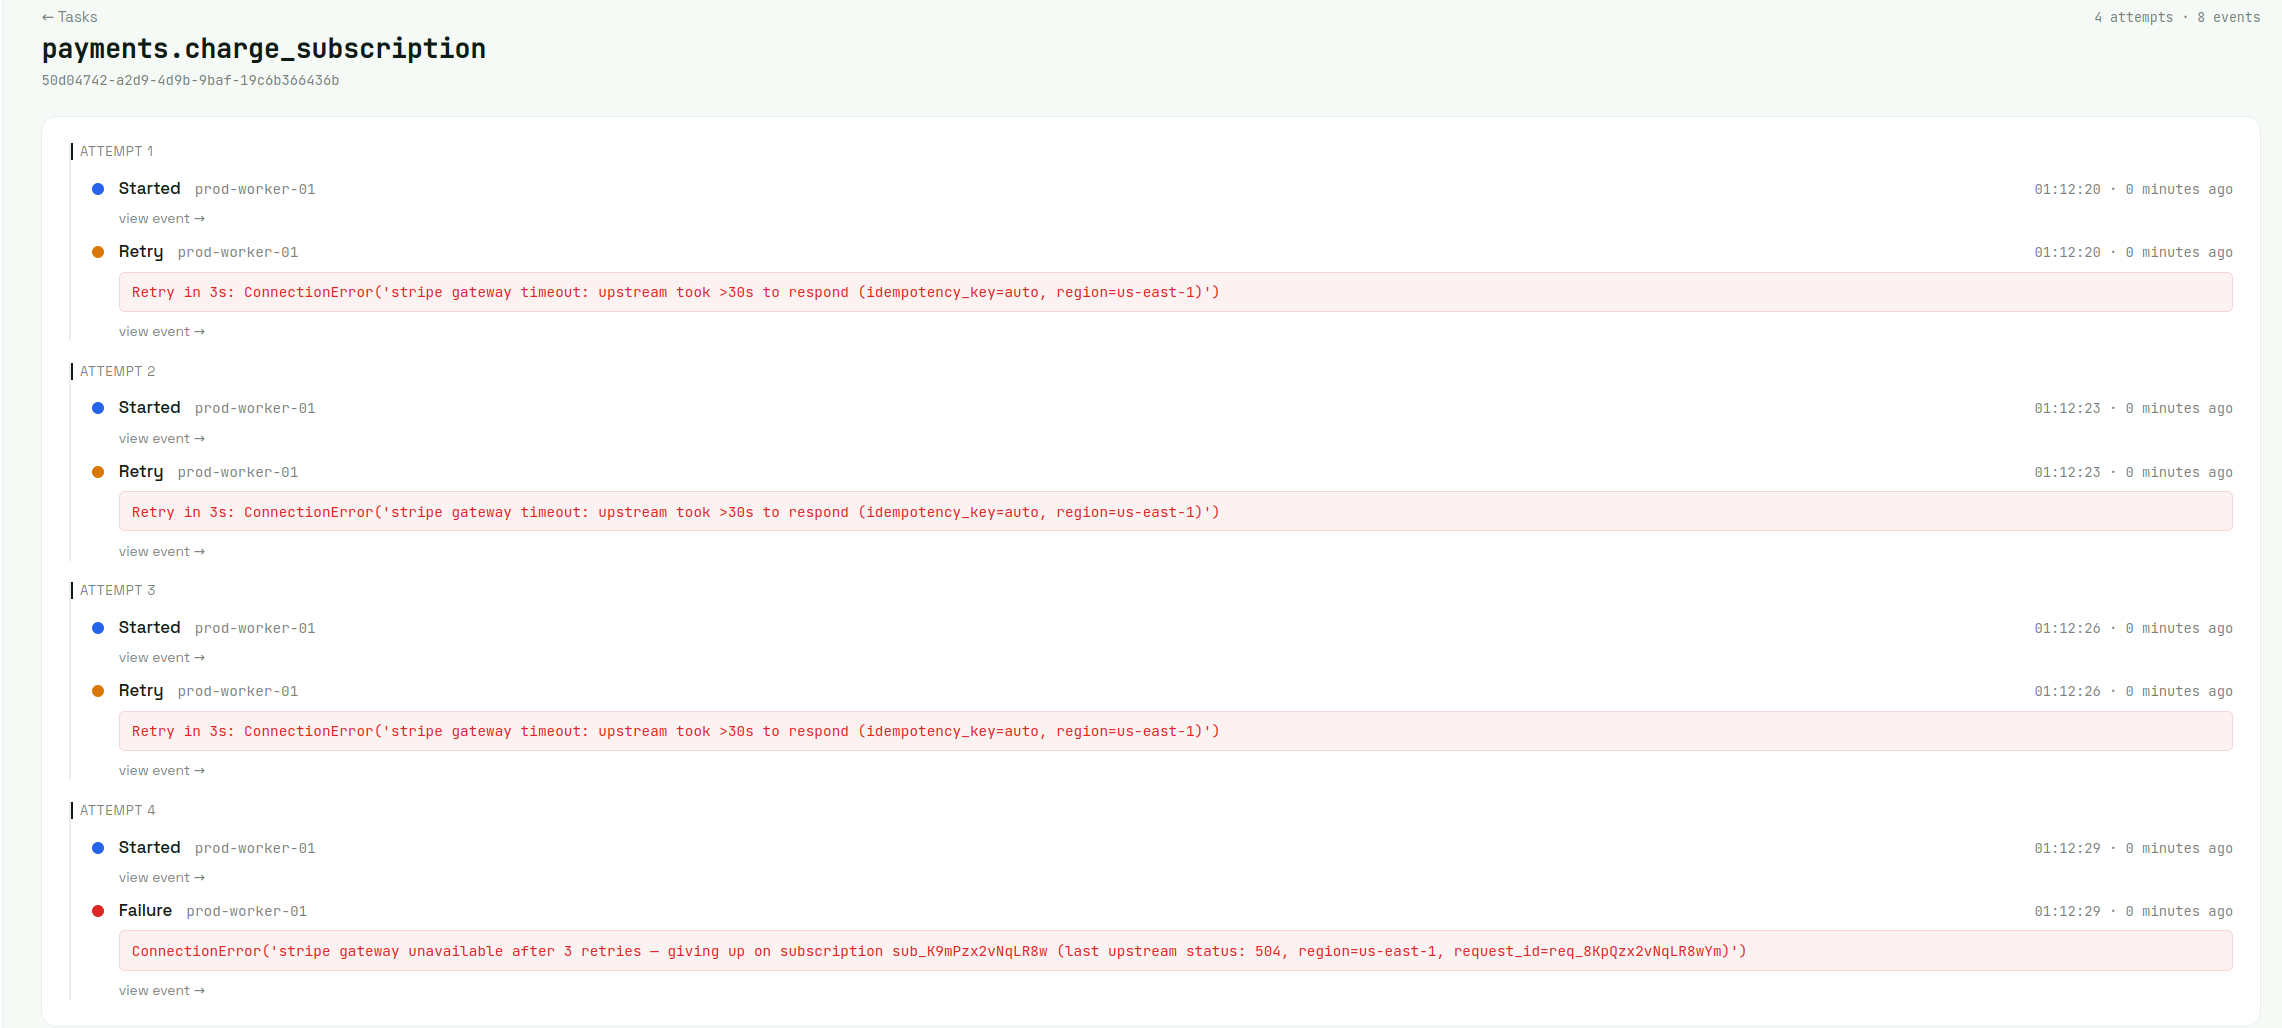
Tasks. Every task event lands in a list view that you can filter and search. Click any failed task and you get every attempt on one timeline: what worker picked it up, what error knocked it back, when Celery finally gave up. Beats piecing it together from log files on three different boxes.
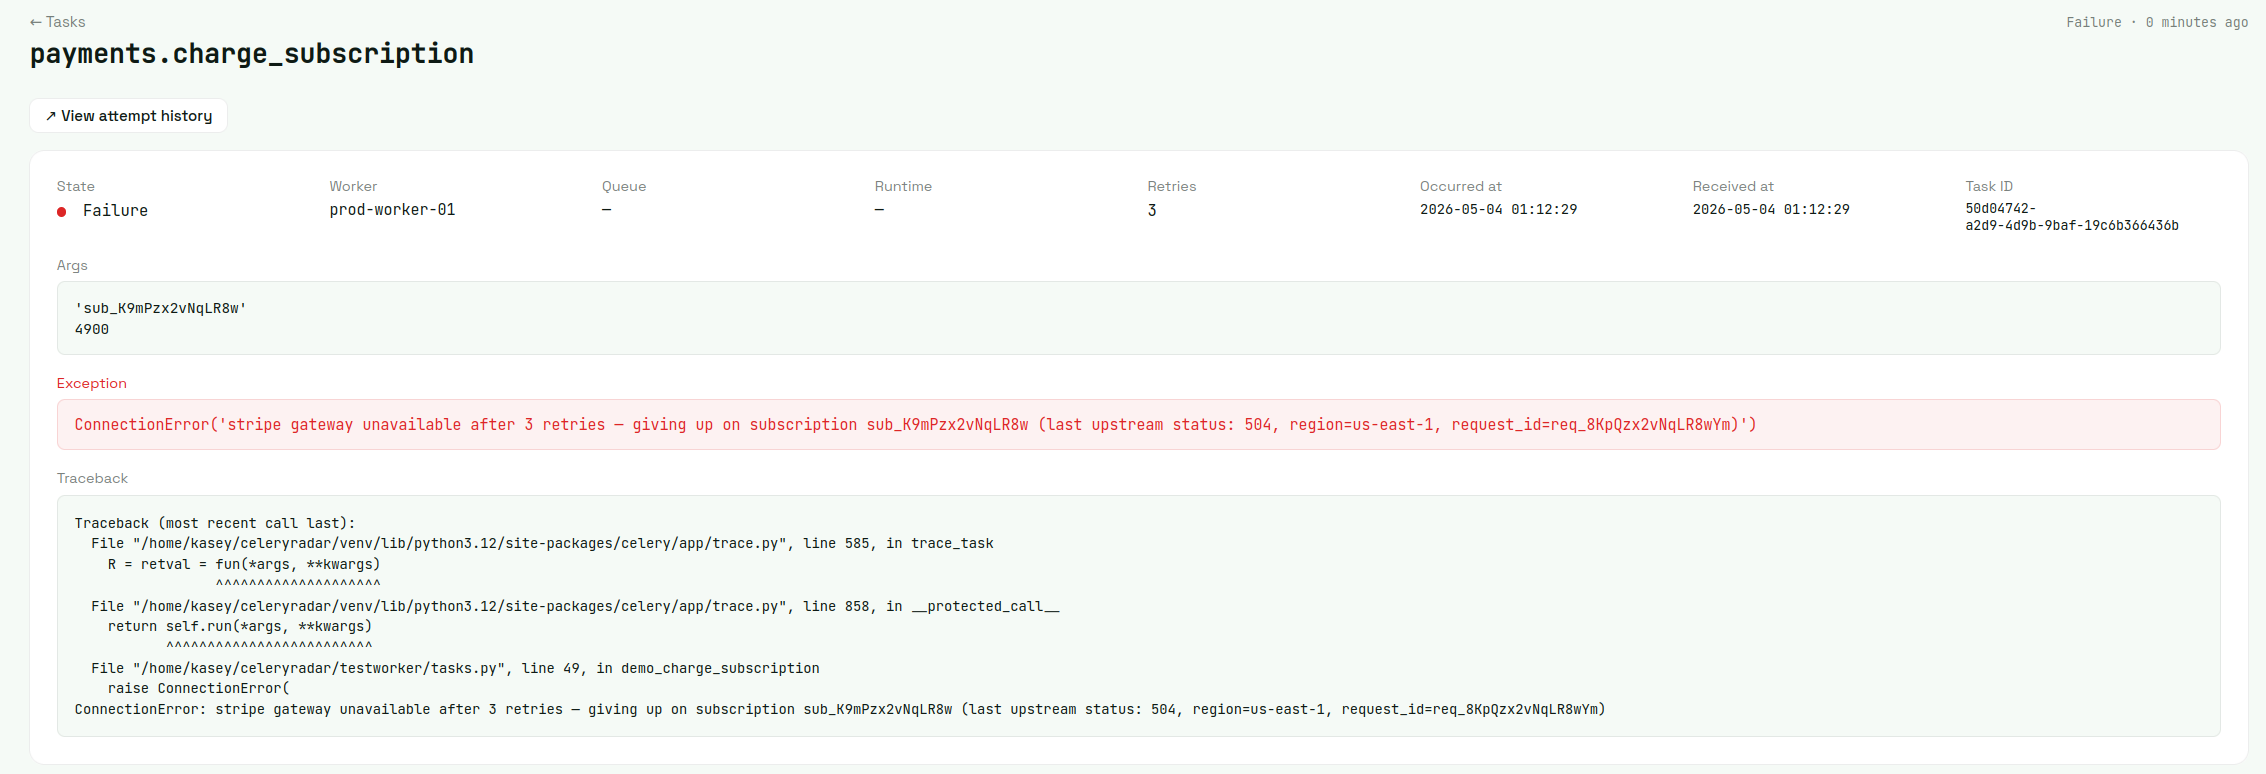
Drill into any single event for the full investigation surface — args, exception, traceback, occurred-at vs received-at, task ID. The filtered task list also exports to CSV from a single click whenever someone needs a report.
Workers. Each worker shows up by hostname with its heartbeat status and queue assignments. Click through for the per-host detail page: 24h stats (tasks processed, success rate, failed count, avg runtime) plus the worker's recent task activity. When a worker process dies or hangs hard enough to stop heartbeating, it flips to offline within the eval window — that's what the worker_offline alert rule fires on.
Beat schedules. This is the signal most other tools handle worst. Each schedule shows its cron expression, when it last fired, when it should next fire, and a status badge if it's overdue. Schedules that haven't fired in their expected window get flagged automatically. Routing that to email or Slack is one beat_miss alert rule away (see below).
Queue depth. Each queue gets its own card with the current depth, the min/max over the last hour, and a 60-minute sparkline of how the depth has moved. Per-queue rather than aggregate, so a slow background queue doesn't get lost in the noise of a fast default queue. Currently Redis-only (single-instance Redis brokers); RabbitMQ, SQS, and Redis Cluster are on the roadmap.
Alerts. Rules engine on top of all four signals. Set thresholds like "task failure rate above 5% over the last 30 minutes," "queue depth above 100 for more than a minute," or "beat schedule X has missed three consecutive fires," and route alerts to email, Slack, or Discord. Single alert per incident by default — cooldowns and incident dedupe stop the 200-pings-from-one-outage problem. Opt in to periodic reminders during an open incident if you want them.
Retention is plan-based. Free tier holds 7 days of task event history, paid plans go up to 90 days. Older data gets deleted automatically.
There's a free tier that's enough for most small teams to monitor production. Paid plans are when you want longer retention or more alerting capacity.
Picking an approach
There's no single right answer. It depends on what you've already got and what you're trying to solve.
If you just need to inspect what's running right now, run Flower locally and call it a day. It's free, it works, you don't need anything more.
If you're already a Sentry customer, their Celery integration plus Crons covers task errors, runtimes (sampled), and beat schedule monitoring. The gaps are worker offline detection and queue depth — if you can live without those, don't add another tool.
If you've got platform engineering time and an existing Prometheus and Grafana stack, build the events consumer setup. You'll get exactly what you want and it'll integrate cleanly with everything else you monitor.
If you're already paying for Datadog or New Relic and want everything under one pane of glass, use their Celery support. The Celery-specific gaps (beat schedules, queue depth, worker heartbeats) are real but you can usually live with them or build around them.
If you want production-ready Celery monitoring without the hassle of running your own setup, hosted is the answer. CeleryRadar is the option built specifically for this. The free tier is enough to find out whether it works for your setup.
The honest meta-rule: most small teams end up at either "Flower for inspection plus hosted for prod monitoring," or "do nothing until the first big outage and then panic-build something." One of those is a better experience than the other.
A 5-minute setup with the SDK
If you decided CeleryRadar is what you want, here's the actual setup.
Install the SDK:
pip install celeryradar-sdkThen in your Celery app, call connect with your API key. The standard place is wherever you create your Celery app instance (usually celery.py in Django projects):
# myproject/celery.py
import os
import celeryradar_sdk
from celery import Celery

app = Celery("myproject")
app.config_from_object("django.conf:settings", namespace="CELERY")
app.autodiscover_tasks()

celeryradar_sdk.connect(
    api_key=os.environ["CELERYRADAR_API_KEY"],
    app_name="myproject",
)
That's the entire wiring. After your next worker restart, task events start landing in the dashboard within seconds. Beat schedule status updates as soon as the first few schedules fire. Queue depth polls automatically.
The defaults are reasonable for most setups. The two overrides that come up most often are capture_args=False (skip sending task arguments — useful when args may contain PII or secrets) and worker_name= (override the hostname; in Kubernetes, gethostname() returns the pod name, which rotates on every restart and accumulates ghost workers in the dashboard):
celeryradar_sdk.connect(
    api_key=os.environ["CELERYRADAR_API_KEY"],
    app_name="myproject",
    capture_args=False,
    worker_name=os.environ.get("WORKER_POOL_NAME", "default"),
)
You get an API key by signing up. The free tier doesn't require a credit card and is enough for most teams to monitor production.
Going further
A few things worth knowing once you're past the initial setup.
Alerts are where the real value lives long-term. Set them up early so you find out about issues before your users do. The rules engine is documented in the concepts page.
Retention windows depend on your plan. Charts beyond your retention period will appear empty. If you need historical data for an incident review, export to CSV before the window passes.
The SDK's internal architecture (async ingest, retry queue, fork safety, payload caps) is documented at how the SDK works. Useful reading if you're running Celery in unusual configurations.
If anything doesn't work or behaves unexpectedly, the troubleshooting page covers the issues that actually come up in practice.
For everything else, the configuration reference has the full kwarg and env var list.