Celery beat monitoring: the underserved problem
Beat is the part of Celery that fires scheduled tasks. It's also the most overlooked part of Celery monitoring. Tasks get dashboards, workers get heartbeats, queues get depth charts. Beat gets a config file and a hopeful "it's been running fine for months." When beat fails, your scheduled work just stops. No errors, no alerts, just silence.
This guide covers why beat monitoring is underserved across the Celery ecosystem, what proper beat schedule monitoring should actually cover, and the six specific ways beat fails in production that monitoring needs to catch.
Why beat monitoring is overlooked
The reason beat monitoring is underserved is structural, not accidental. The tools that dominate Celery monitoring all came from somewhere else, and beat sits in the gap between their primary signals.
Flower came from the "what's happening right now" angle. It's a real-time inspector, a web UI for currently-running tasks and currently-online workers. Beat schedules are mostly invisible to a real-time inspector because a fire happens once and disappears into the task stream. You can see the task the fire produced, but you can't easily see whether the schedule fired on time, or whether it's still firing at all. Flower has no native beat monitoring.
The APMs (Sentry, Datadog, New Relic) came from error tracking and performance monitoring. They treat your Celery deployment as a stream of tagged transactions, which works for noticing when a task starts throwing exceptions, but doesn't tell you when a scheduled task simply didn't fire. Sentry Crons covers crons specifically, but only when you opt in by setting monitor_beat_tasks=True plus per-schedule decorators. Most teams don't realize they need both. Datadog scrapes Flower's Prometheus endpoint and inherits Flower's blind spot. New Relic auto-instruments tasks, not schedules.
Cronitor and similar cron-monitoring services do beat-style monitoring well, but they assume you'll instrument each schedule manually with a heartbeat ping at the start and end of each run. That works for traditional cron, but it's a lot of decorator-glue for a Celery beat schedule that may dynamically register itself via django-celery-beat or RedBeat after the deploy.
The result is a category gap. There's no first-class tool whose primary signal is "did this beat schedule fire when it should have?" Most monitoring stacks technically can answer the question if you wire it up by hand, but very few do. Most teams find out their beat monitoring was incomplete the same way: a scheduled job stops firing, weeks pass, somebody downstream notices the missing output, and the timeline reconstruction starts.
What proper beat monitoring entails
Proper beat schedule monitoring isn't one signal. It's four:
Registration. Did your scheduled task make it into beat's internal registry? With django-celery-beat, the PeriodicTask row needs to exist and be marked enabled. With RedBeat, the schedule key needs to exist in Redis. With the default scheduler, the entry needs to be present in app.conf.beat_schedule. A schedule that never registered will never fire, and the failure is silent because there's nothing for monitoring to track the absence of.
Fire detection. For each registered schedule, did each expected fire window actually produce a fire? A schedule set for every five minutes that hasn't fired in the last seventeen minutes has missed three windows. Most monitoring tools don't track this directly. They only see the task that the fire produced, if it produced one. The window in which a fire should have happened but didn't is the part most setups can't observe.
Drift detection. When a fire happens, does it happen on time? A schedule set for midnight that fires at 12:23 every day has clock drift, broker contention, or scheduler lag. Drift often shows up as small lag first and full misses later. Catching drift early is how you find the failure mode before it escalates.
Task outcomes. When the fire dispatches a task, does the task succeed? Beat firing correctly is necessary but not sufficient. If the task it dispatches fails on every attempt, your scheduled work isn't getting done. This is the only one of the four that overlaps with general task monitoring.
Most tools cover one or two of these. Sentry Crons covers fire detection and task outcomes well, but only with explicit decorators. Flower covers task outcomes but not fire detection. The Prometheus-and-Grafana DIY approach can cover all four if you build it carefully, but most teams don't.
The rest of this guide assumes you want all four, then walks through the six specific failure modes that complete beat monitoring needs to catch.
The 6 ways beat fails in production
1. The beat process isn't running
Most common, most embarrassing. The beat process never started, or it crashed and didn't get restarted. Reasons: the systemd unit failed at boot (missing dependency, typo in ExecStart); supervisor config was wrong (worker process running but no beat process defined); the Kubernetes deployment is in CrashLoopBackoff; somebody on the team killed the process during an unrelated debugging session and forgot to restart it.
It's silent because nothing produces tasks at all. Worker monitoring won't catch it (the workers are fine, they just have nothing to do). Task monitoring won't catch it (no failed tasks, just no tasks). Queue depth won't catch it (depth is zero, which looks healthy).
Detection has to come from outside the beat process. Monitoring needs to know your schedules' expected fire windows independently and alert when expected fires don't happen.
2. The schedule entry never registered
The schedule was added in code but never made it into the beat instance's live registry. The variants:
- django-celery-beat: the
PeriodicTaskrow exists butenabled=False, or the migration that creates it didn't run in the deployed environment. - RedBeat: the schedule key wasn't written to Redis (race during startup, or beat connected to the wrong Redis database).
- Default scheduler:
app.conf.beat_schedulewasn't reloaded after a deploy that added a new entry. - Custom schedulers: the scheduler doesn't poll for new entries until the next restart, and your deploy added an entry mid-cycle.
The "I deployed the change and it didn't take" failure splits into two cases. If a schedule was previously registered and then removed (intentionally or by mistake), CeleryRadar deactivates it cleanly. That's the right default for intentional removals (no phantom alerts forever after you delete something), and unintentional ones show up as deactivated rows in the schedules page rather than alerts. The "added in code, never loaded by beat" variant is harder for any auto-discovery tool to catch and is better served by per-schedule decorators (Sentry Crons, Cronitor) where the decorator's invocation is itself the source-of-truth signal.
3. Clock or timezone drift
Beat fires off the host's clock. If the clock is wrong, fires are wrong. The classic shapes:
- VM or container clock skew because NTP isn't running or is misconfigured.
- Timezone mismatches:
CELERY_TIMEZONEset to one zone, the database to another, the application server to a third. Each schedule's interpretation depends on which timezone wins, and it's not always the one you expected. - DST transitions: schedules set in local time miss or duplicate fires twice a year.
- Container scheduling: starting a container with the wrong
TZenv var shifts the entire schedule by however many hours the offset is.
Detection: monitoring should know each schedule's expected fire times in absolute UTC, compare against actual fires, and alert on consistent drift past a small threshold (60 seconds is reasonable; anything less is broker latency noise).
4. Beat lock contention
Running multiple beat instances by accident. The default scheduler doesn't distribute its lock. Running two beats means every fire happens twice, every scheduled task runs twice, and idempotency assumptions in your task code start mattering in ways they didn't before.
RedBeat's distributed lock via Redis is the standard fix. It works correctly when configured, but lock-acquisition failures are silent: one beat wins the lock and runs schedules, the others sit idle waiting. When the winner dies, one of the idle beats takes over. Usually. If lock handoff fails (Redis evicts the lock key, the winner crashes without releasing, two beats race for the lock at the same instant), schedules can stop firing entirely while every beat process appears alive.
The most common variant is a deploy that creates a new beat pod before the old one terminates; both fire for a few minutes until the old one drains. Detection is duplicate fires (lock missing) on one side and missed fires despite the beat process appearing alive (lock stuck) on the other.
5. Broker connection loss
Beat publishes to the broker (Redis or RabbitMQ). If the connection drops silently, fires happen but the messages don't land. Beat thinks it's working; nothing's actually getting done.
Redis-specific failure: keys get evicted under memory pressure, especially with maxmemory-policy: allkeys-lru and no separate Redis instance for Celery. RabbitMQ-specific failure: the channel drops without reconnecting cleanly; beat keeps trying to publish but messages don't reach the queue. The reconnect logic exists but is timing-dependent, and edge cases (DNS hiccups, partial network partitions) can leave it in a degraded state.
The symptom is unique among these failure modes: beat process appears healthy, schedules appear registered, drift looks fine, but the tasks beat is supposedly dispatching never run. Detection requires correlating fires (what beat published) with task events (what workers received). A fire without a corresponding task event is broker-side loss.
6. Custom scheduler bugs
Most teams use django-celery-beat or RedBeat, but some run a custom scheduler: third-party packages, internal tooling, or a subclass of the default. Custom schedulers have a few specific failure shapes:
- Future Celery versions can rename internal scheduler attributes (e.g. private fields like
_orig_minute); custom schedulers that subclass and reach into internals break on Celery upgrade. - Re-sync intervals don't match what your code assumes. The scheduler may only check for new entries every 60 seconds; an entry you add expecting it to fire in 30 won't.
- Edge cases in cron parsing. Every scheduler implements cron-expression handling slightly differently, and the corner cases (overlapping ranges, step values, unusual day-of-week semantics) are where the bugs live.
Less common than the other five, but causes prolonged incidents because few people on the team know to check the scheduler-specific code path. Detection is the same as failure mode 2 (compare expected vs registered) plus the same as failure mode 3 (compare expected fire times vs actual).
Detecting these in production
The pattern across all six failure modes is the same: monitoring needs to know what your schedules should fire, and when, independently of the beat process. If monitoring can only see what beat reports, every failure mode where beat is wrong about its own state is invisible.
The mechanisms that work:
- Per-schedule expected-fire-window tracking. Store each schedule's cron expression or interval, the last fire time, and the next expected fire time. Every minute, compute "should X have fired by now?" and alert when yes-but-it-didn't. This catches failure modes 1, 4 (lock-stuck variant), 5 (full broker disconnect), and 6.
- Registry snapshot diffing. Track which schedules appear in successive snapshots from beat. Schedules that disappear get auto-deactivated, which keeps the dashboard clean after intentional removals and surfaces unintentional ones as deactivated rows in the schedules page. Note that this isn't an alert path; the never-registered-in-the-first-place variant of failure mode 2 requires per-schedule decorators (Sentry Crons, Cronitor) since the decorator's invocation is the source-of-truth signal.
- Fire-to-task correlation. A fire event is when beat publishes to the broker; a task event is when a worker picks it up. Tracking both lets you spot fires that didn't produce tasks (broker-side loss, failure mode 5).
- Drift alarms. Compare actual fire times against expected fire times. Alert on consistent drift past threshold. Catches failure mode 3.
There are two mature ways to get this in production. The first is to instrument each schedule manually with Sentry Crons (monitor_beat_tasks=True plus per-schedule decorators) or with Cronitor heartbeat pings. Both work well for teams already using those tools, but require per-schedule wiring and miss the registration failure mode entirely (an unregistered schedule has no decorator firing because no fire is happening).
The second is to use a tool that auto-discovers your beat schedules and tracks fire windows independently of beat. That's the gap CeleryRadar specifically fills.
Setting up beat monitoring with CeleryRadar
If beat schedule monitoring is a gap in your current setup and you don't want to instrument each schedule by hand, CeleryRadar handles it automatically.
pip install celeryradar-sdkIn your Celery app:
# myproject/celery.py
import os
import celeryradar_sdk
from celery import Celery

app = Celery("myproject")
app.config_from_object("django.conf:settings", namespace="CELERY")
app.autodiscover_tasks()

celeryradar_sdk.connect(
    api_key=os.environ["CELERYRADAR_API_KEY"],
    app_name="myproject",
)
The SDK hooks Celery's beat_init signal to read your registered schedules at beat startup, periodically re-syncs (so dynamic additions via django-celery-beat or RedBeat are picked up without a beat restart), and tracks every fire via before_task_publish. The backend computes expected fire windows server-side and materializes a "missed" record for any window that passes its grace period without a fire.
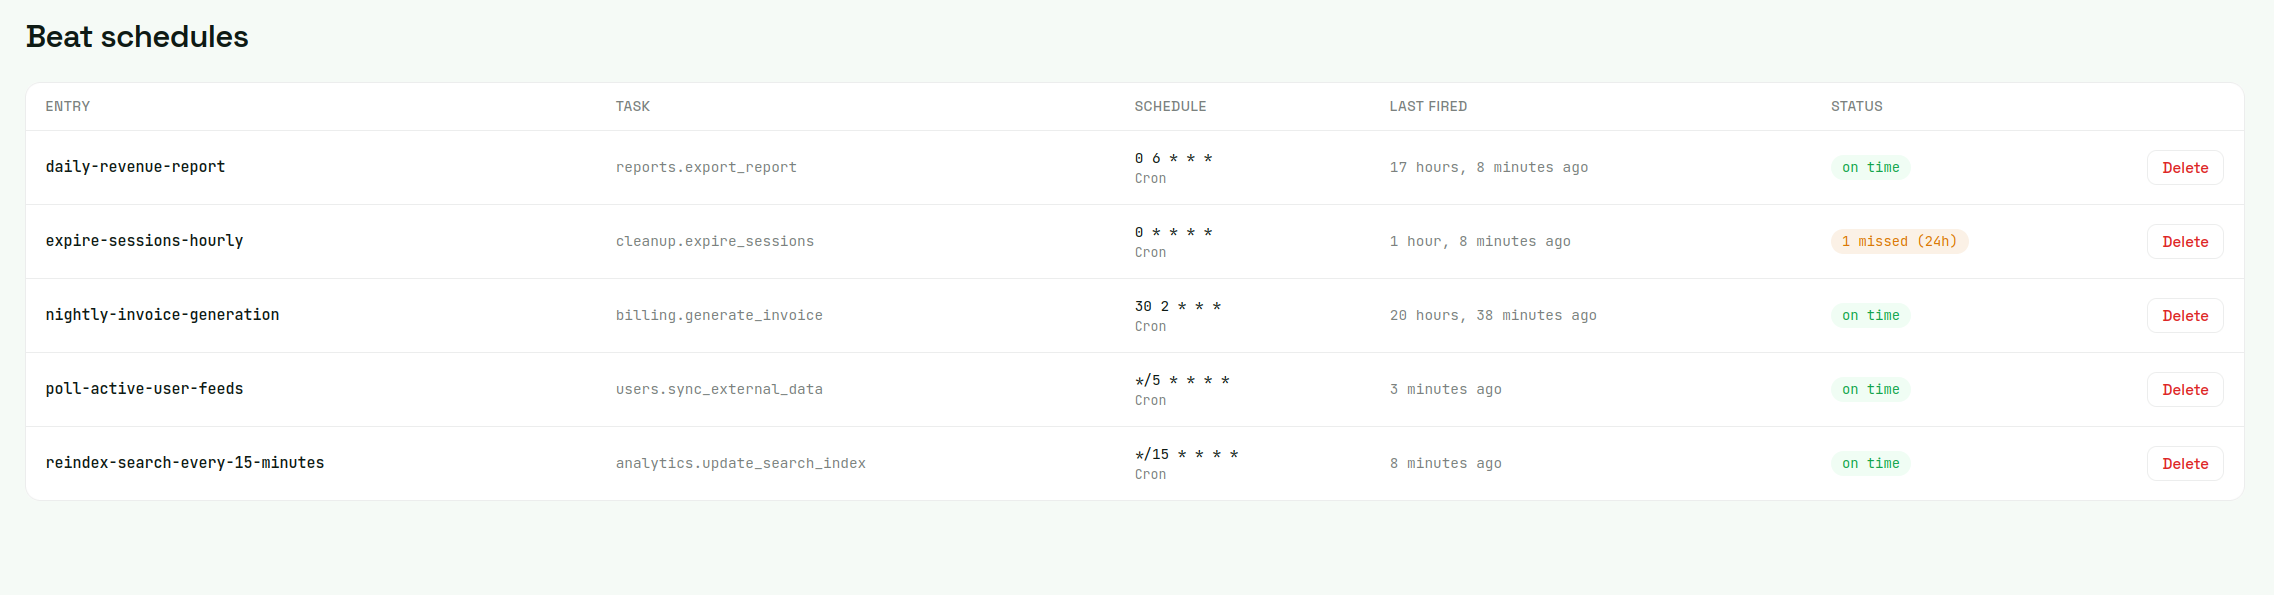
From there, add a beat_miss alert rule. Pick a schedule, set the consecutive-misses threshold (1 for high-frequency schedules where every miss matters; 2-3 for noisier crons), pick a delivery channel (Slack, Discord, email).
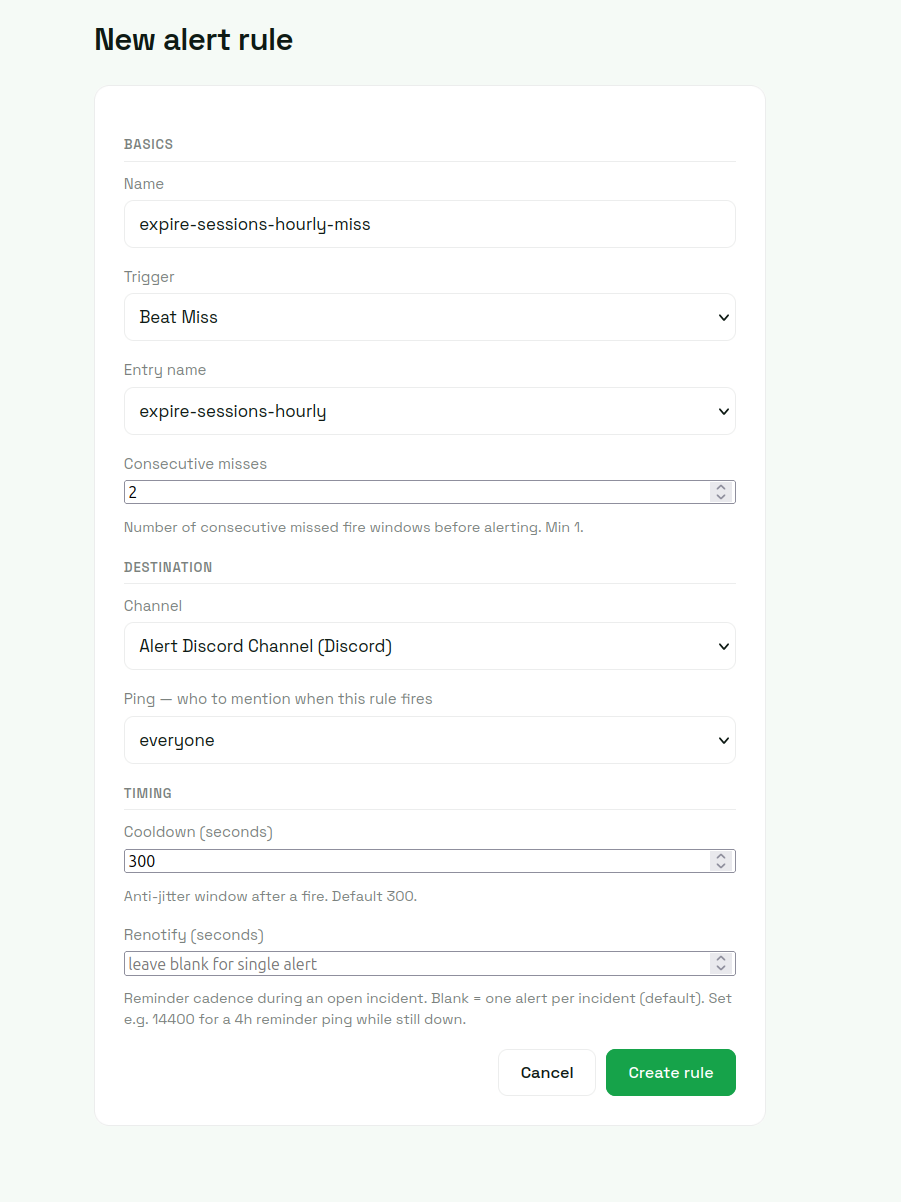
That's the entire wiring. The failure modes that surface as beat_miss alerts are 1 (beat process down), 4 (lock-stuck), 5 (broker disconnect), and 6 (scheduler bugs that prevent fires). Four of the six caught with no per-schedule instrumentation. Mode 3 (drift) shows in the dashboard as last-fired-vs-expected divergence but doesn't alert directly unless drift is severe enough to push a fire past its grace window. Mode 2 (registration) splits: registered schedules that get removed deactivate cleanly (correct behavior for intentional removals, visible in the schedules page for unintentional ones), and the rarer "added in code but never loaded" variant is best caught with per-schedule decorators on top.
Closing
Beat is the underserved part of Celery monitoring because the tools that dominate the Celery monitoring space came from adjacent problems: real-time inspection (Flower), error tracking (Sentry), broad APM (Datadog, New Relic), generic cron monitoring (Cronitor). Each handles part of the four-signal coverage; none handle all of it natively without per-schedule wiring.
If you're already running one of those tools and your beat schedules are simple enough that the manual wiring is fine, that's the cheapest answer. If you're in the larger group (teams with dynamically-registered schedules, a mix of django-celery-beat and ad-hoc entries, or just no appetite for per-schedule decorators), beat monitoring as a first-class signal is what closes the gap.
For the rest of the Celery monitoring picture (tasks, workers, queue depth), see the full guide on monitoring Celery in production.